
In order to plan drifter and dye deployments as part of RIVET at new river inlet, we’ve been looking at model simulations from UDEL (Hsu et al. – NEARCOM), U Miami (Reniers et al. – Delft3D) as part of the DRI, and also UNC (Leuttich et al. – ADCIRC) who have graciously given us some model simulation data. We’ll be posting results from each of the simulations here.
First up is NEARCOM (U Del). They ran 3 scenarios. They are:
- M2 Tides + normally incident waves (offshore Hsig = 1 m)
- M2 Tide only (no waves)
- M2 Tide + waves but with drag coefficient 10X larger
The (U,V,eta) over the inlet domain was decomposed into principal components to get major axis and minor axis tidal ellipses. Then the phase lag between the tide level (eta) and the major axis tidal velocity was computed (zero is a progressive wave, 90 deg is a standing wave). Below is shown (left panels) the phase difference and (right panel) std of major axis velocity (multiply by sqrt(2) to get peak amplitude) for the 3 cases above.

Things to note:
- The waves do not seem to have a strong effect on the tidal currents
- Friction makes a big difference
- It is hard to tell how many hrs the velocity lags the tide level in this plots. Soon we will have ADCIRC and Delft3D runs analyzed to compare to. This will make it easier to see.
For the tide+waves NEARCOM (#1 above) run a time series is a little clearer. Below is a eta (blue), U,V (red,green) timeseries over 12 hours of at one location inside the inlet.
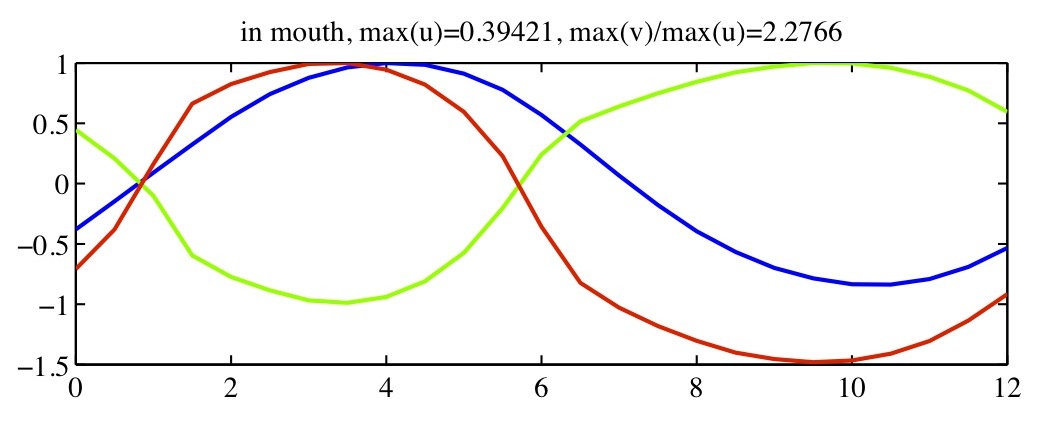
Note how the maximum in tide occurs at t=4 hrs, but the velocity does not start to ebb (switch sign, see red) until t=5.75 hrs or so.