
Below is a google earth image of the WHOI (Raubenheimer/Elgar) & SIO (Feddersen/Guza) sensor deployment plan. We coordinated last week to get the best coverage from all of our sensors. Steve Elgar made the nice map below. It will change once we get the new survey after the dredging, but this gives an idea of # of instruments and their distribution. Note, the red symbols are WHOI (Raubenheimer/Elgar).
- Black center = ADCP + pressure
- Red = ADV + P
The other symbols are SIO (Feddersen/Guza)
- White Squares = ADV (vector, denoted SIO-V*)
- Magenta circ = Aquadopps (denoted SIO-A*)
- White Diamonds = WireWalker (CTD+F) + ADCP: the WireWalker are set up in a cross-shore array from the entrance of the dredged channel. One in ~8 m depth and another in ~ 12 m depth. Each WW will measure dye and turbidity with an Ecotripplett (ET)
- Additional: 13 WetLabs EcoTriplett (ET) (not shown in image) to deploy across these locations to meet two goals 1) measure the dilution downstream from the release point 2) measure something like the total flux in and out of the inlet. To this end one plan is to deploy ET near: a) for Downstream Dilution: 04, 0a, 06, 08, 0c; and (b) for Flux: 85, 86, 87, 78, SIO-V7, SIO-V6, SIO-A3, 17
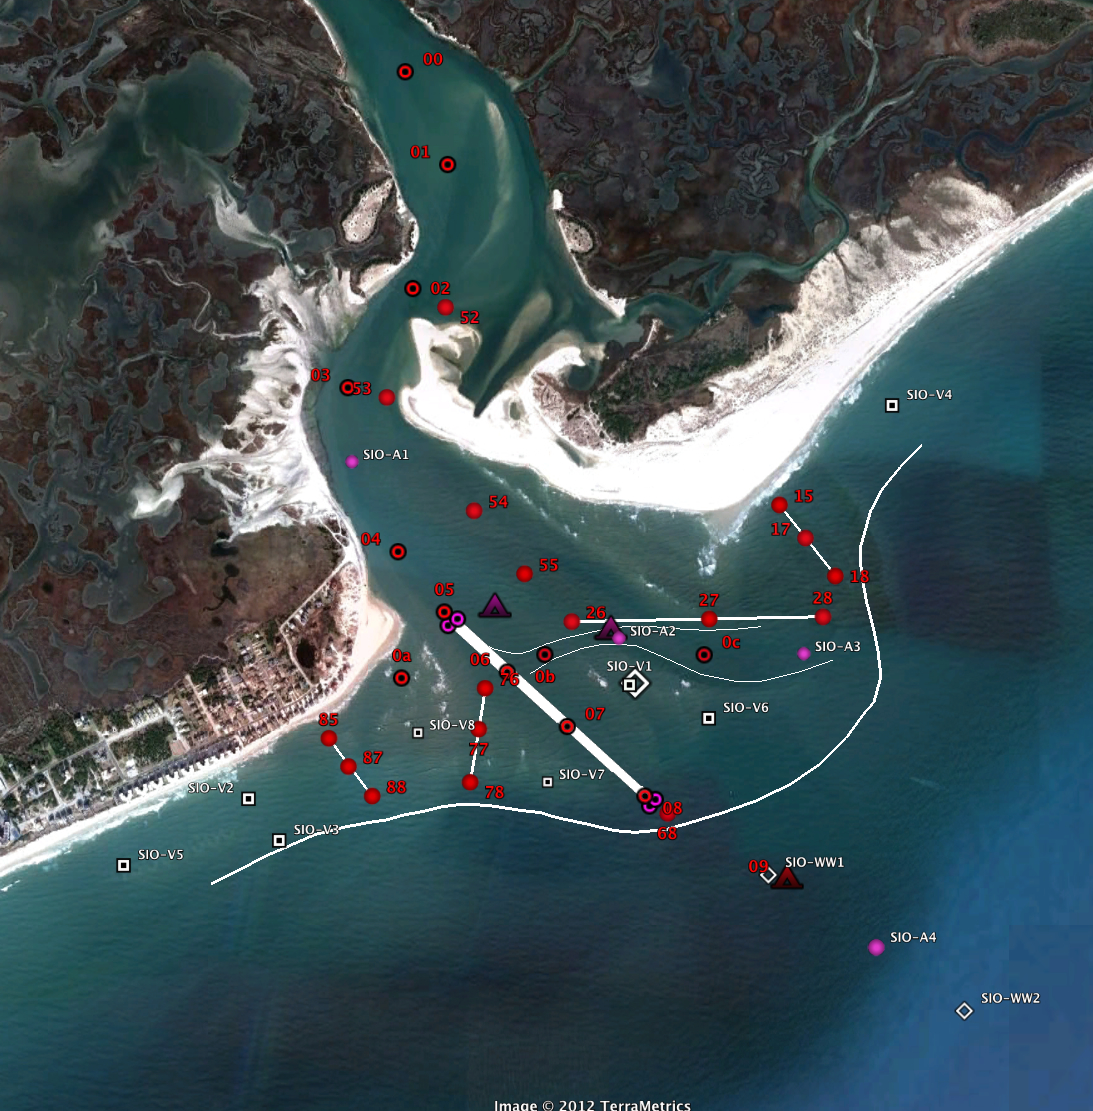
The thick white line is the location of the new (to be dredged) channel. The very thin white lines mark the location of the “current” channel. The medium white contour marks an educated guess of the 4 m depth contour.
There are many other instruments being deployed by various groups (NPS/UMiami, UNH, SIO-Terrill, WHOI-Traykovski/Geyer) among others.