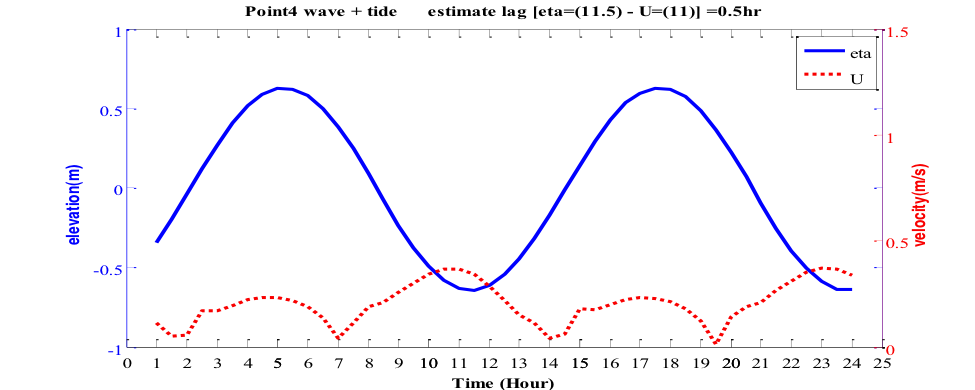
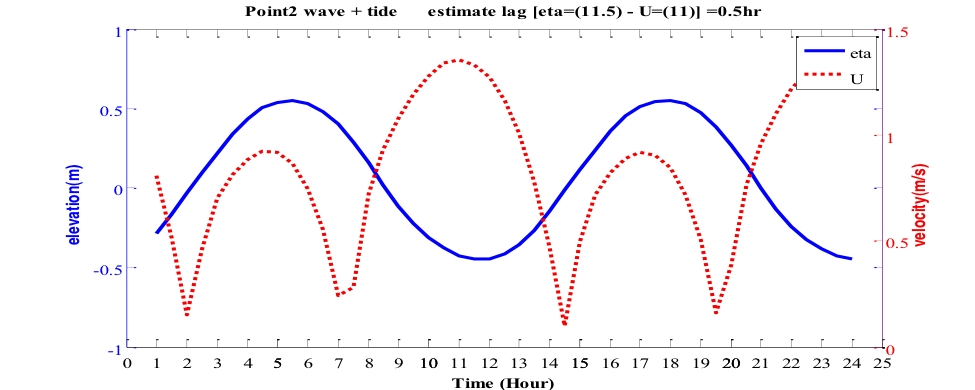
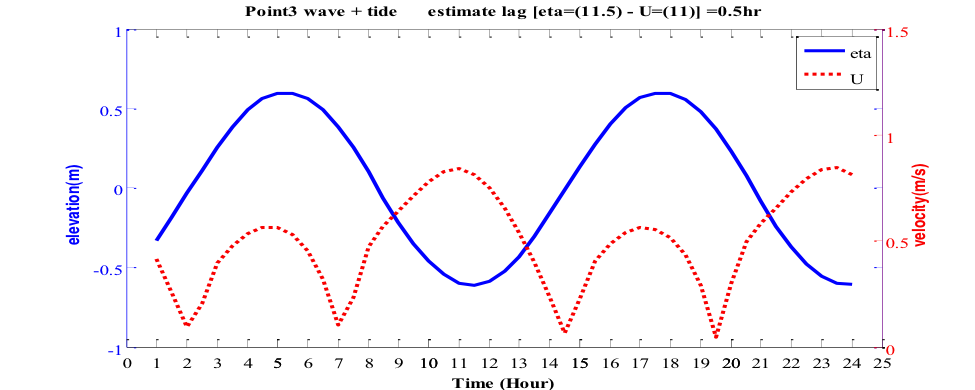
by Tom Hsu, Fengyan Shi, and Julie Chen (UDEL): I just like to follow up with Falk’s comments on time series and phase lag between surface elevation and flow velocity magnitude. More information from the model run is attached. In this document, you will find time series at four different locations. Please also notice that in these figures, we show tidal velocity magnitude (not individual components), which is probably more representative. Basically, max ebb occurs 0.5~1 hour before low tide.
As Falk mentioned, the results seems to be sensitive to bottom friction used. We are evaluating the sensitivity and will give you an update soon. We also plan to run realistic tide, which can make a difference in phase. Once we have update, we will post on the blog (and we may provide a link where you can download more specific and detailed data from our own website).
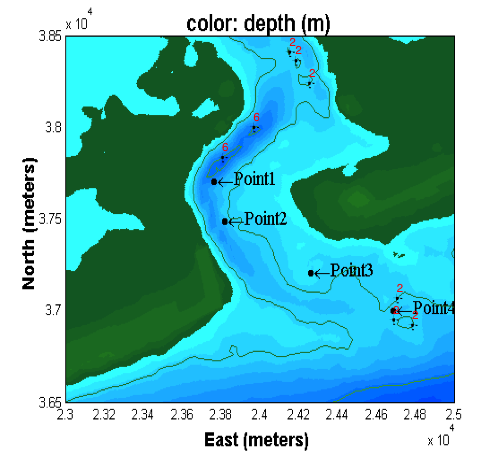
Bathymetry: from Summer 2011
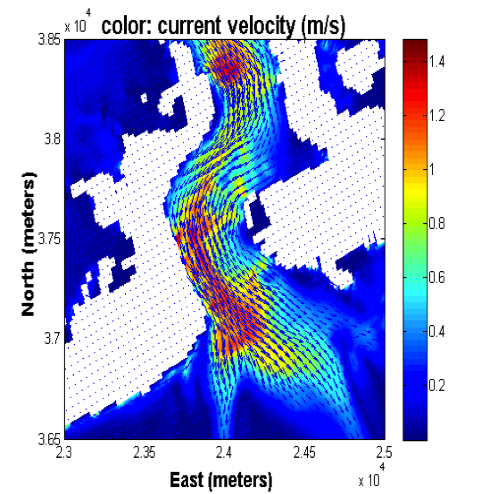
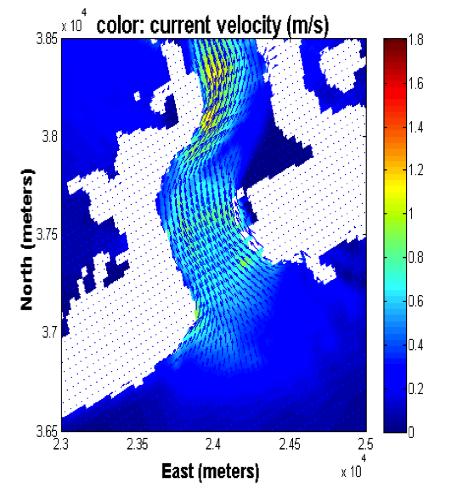
Offshore Conditions: Normally incident waves Hs=1 m. Drag coef Cd=0.01, Tide Level =0.623 m
Max EBB
Max Flood
Time series of tidal elevation and tidal velocity magnitude:
Point 1: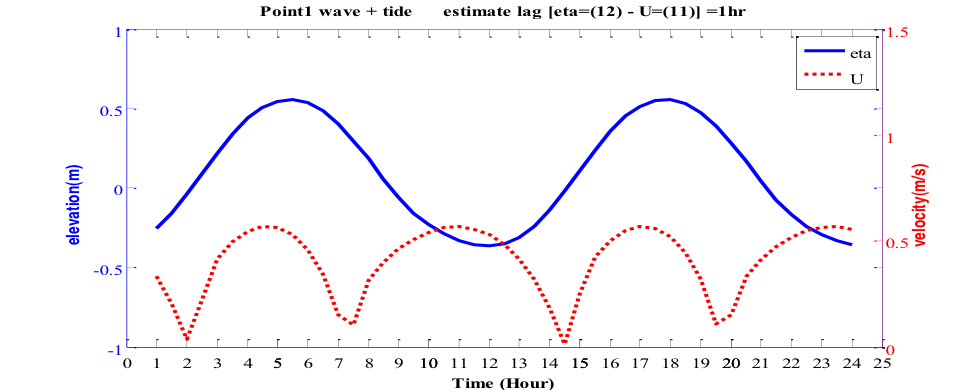
Point 2:
Point 3:
Point 4: