In order to understand how to time drifter and dye releases, I’ve become preoccupied with the New River Inlet tidal currents and the phase lag relative to the tide level (call this eta). As is well known a standing wave has a 90 deg (pi/2) phase lag between eta and velocity and a progressive wave has a 0 deg lag. In a tidal inlet, the tide is somewhere in between the two. Another way of asking the question is how soon after high tide will the water velocity ebb (go out the inlet) – that is. time of max (eta) – time when U switches to flood. Here, numerical models can help us, although one must be careful as the tide-velocity phase relationship depends on the friction inside the inlet.
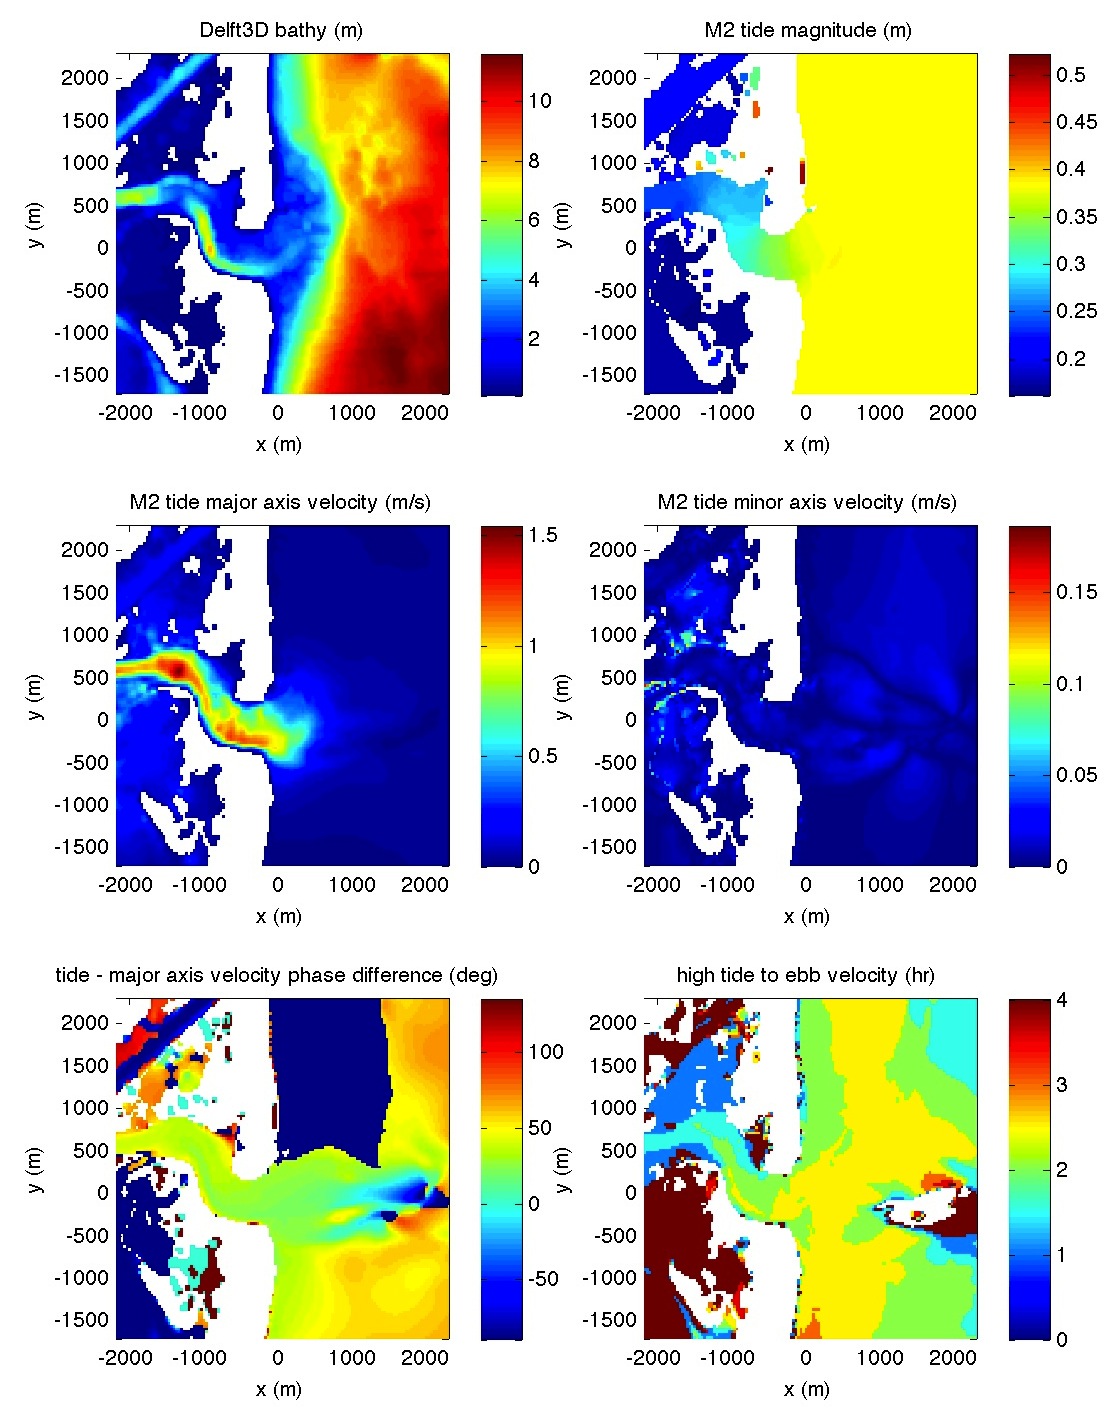
In a previous posts, NEARCOM model results were shown. Ad Reniers and Patrick Rynne at Univ. Miami have kindly provided me with some Delft3D M2 tidal model simulations of the New River Inlet. I believe this is the same bathymetry as for the NEARCOM model runs. Patrick sent me the data over 4 M2 tidal cycles output every 1/2 hour. Results are shown below. The panels are (top,L ) bathymetry, (top,R) M2 tide magnitude [i.e., eta = eta_0 cos( omega t) ] , (mid, L) major axis velocity magnitude, (mid,R) minor axis velocity magnitude, (bottom, L) phase lag between eta and major axis velocity and (bottom, R) time in hrs from high tide to when water starts ebbing.
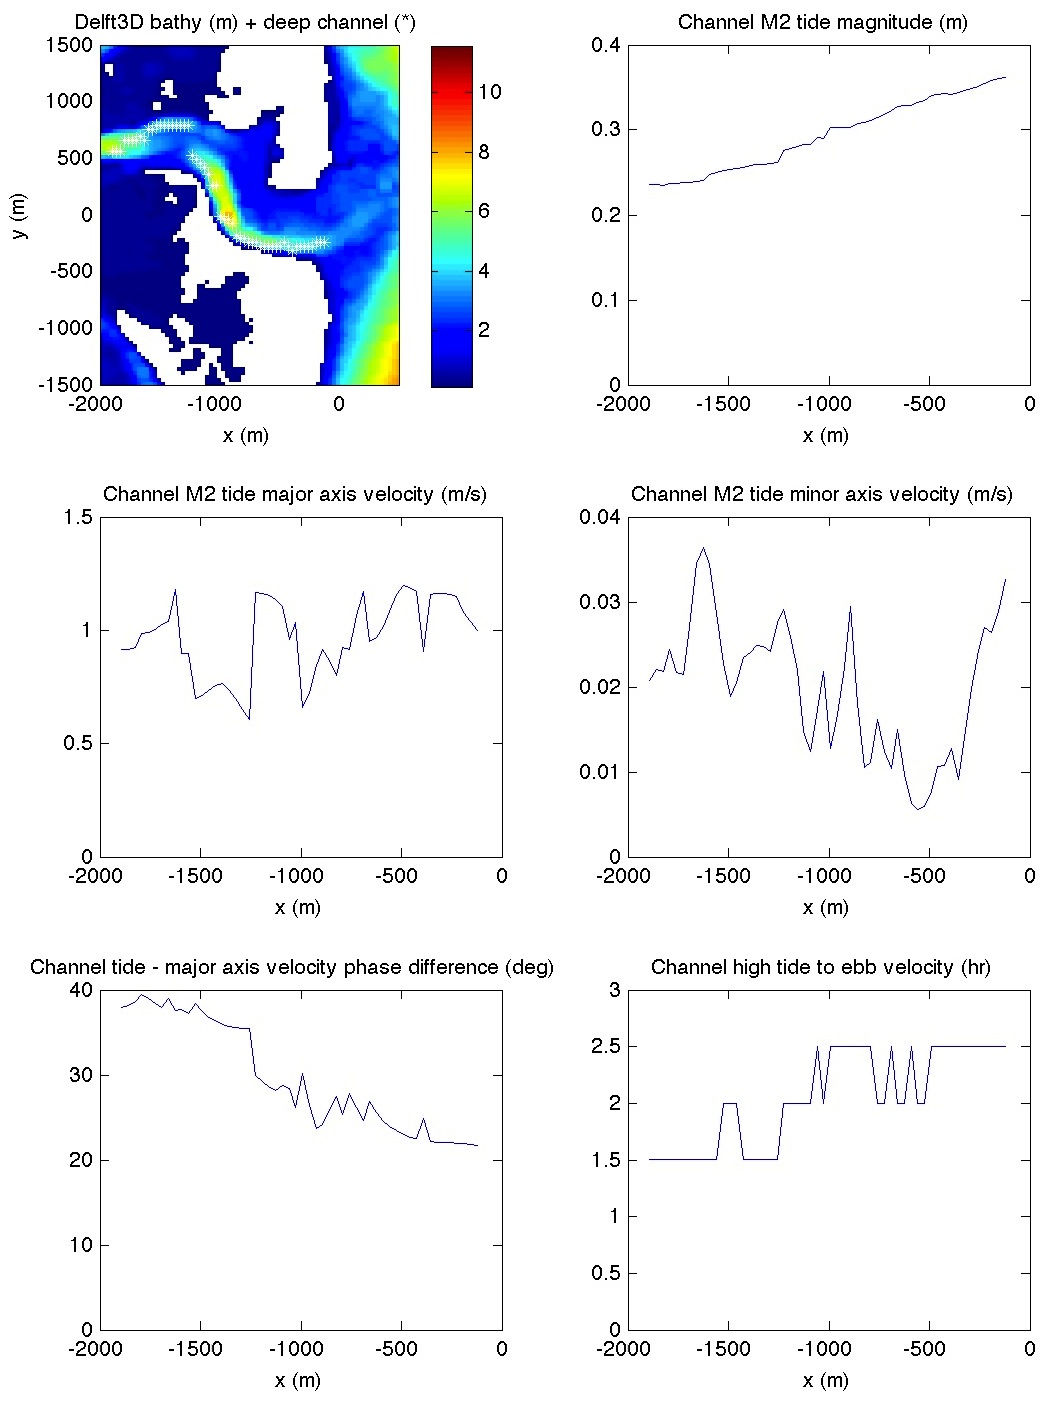
Note that there are similarities and differences between the Delft3D and NEARCOM simulations. From these plots it is hard to tell what the tide magnitude, currents, and phase is within the inlet. Below is the same quantities at the deepest portion of the inlet at any cross-shore position. The bathymetry panel (top, L) marks the deep channel locations with white asterisks (squint cause they are hard to see).
As expected, the tide magnitude decreases as one goes up the channel (top, R). This is fairly linear. The major axis velocities (~ 1 m/s) also sorta decrease but oscillates, because the channel depth is not regular. The minor axis velocities are small. The phase lag is interesting. Near the mouth (x ~ 0 m), the lag is ~21 deg – far closer to a progressive wave than a standing wave. This corresponds to a 2.5 hour lag between high tide and water velocity beginning to ebb (the phase difference and time lag are not excactly related because of nonlinearities and skewness in tidal velocities). The phase slowly increases up the inlet (more negative x). And the time to go from high tide to ebb velocity also decreases.
We will compare these results with the other models (NEARCOM and ADCIRC) coming soon. -Falk

