
In the previous post on Delft3d model output, we showed in one of the panels, the time it takes from high tide until the water starts to ebb. Notationally this could be written as t_{high tide} – t_{Uebb}, where t_{Uebb} is the time when the alongchannel tidal velocity switches to ebb (out of the inlet). This time lag is related to the M2 eta/V phase lag, but is slightly different due to skewness in the tidal velocities related to the water level going up and down. To better compare the two models, we made the same calculation with the 3 NEARCOM model runs – see previous posts. They are (a-top) waves+tide, (b-mid) tide only, and (c-bottom) 10X drag coefficient, waves+tide. The results are shown below. The left panels are the time lag from high tide to velocity, the R panel is the std of alongchannel velocity (the same as in previous posts).
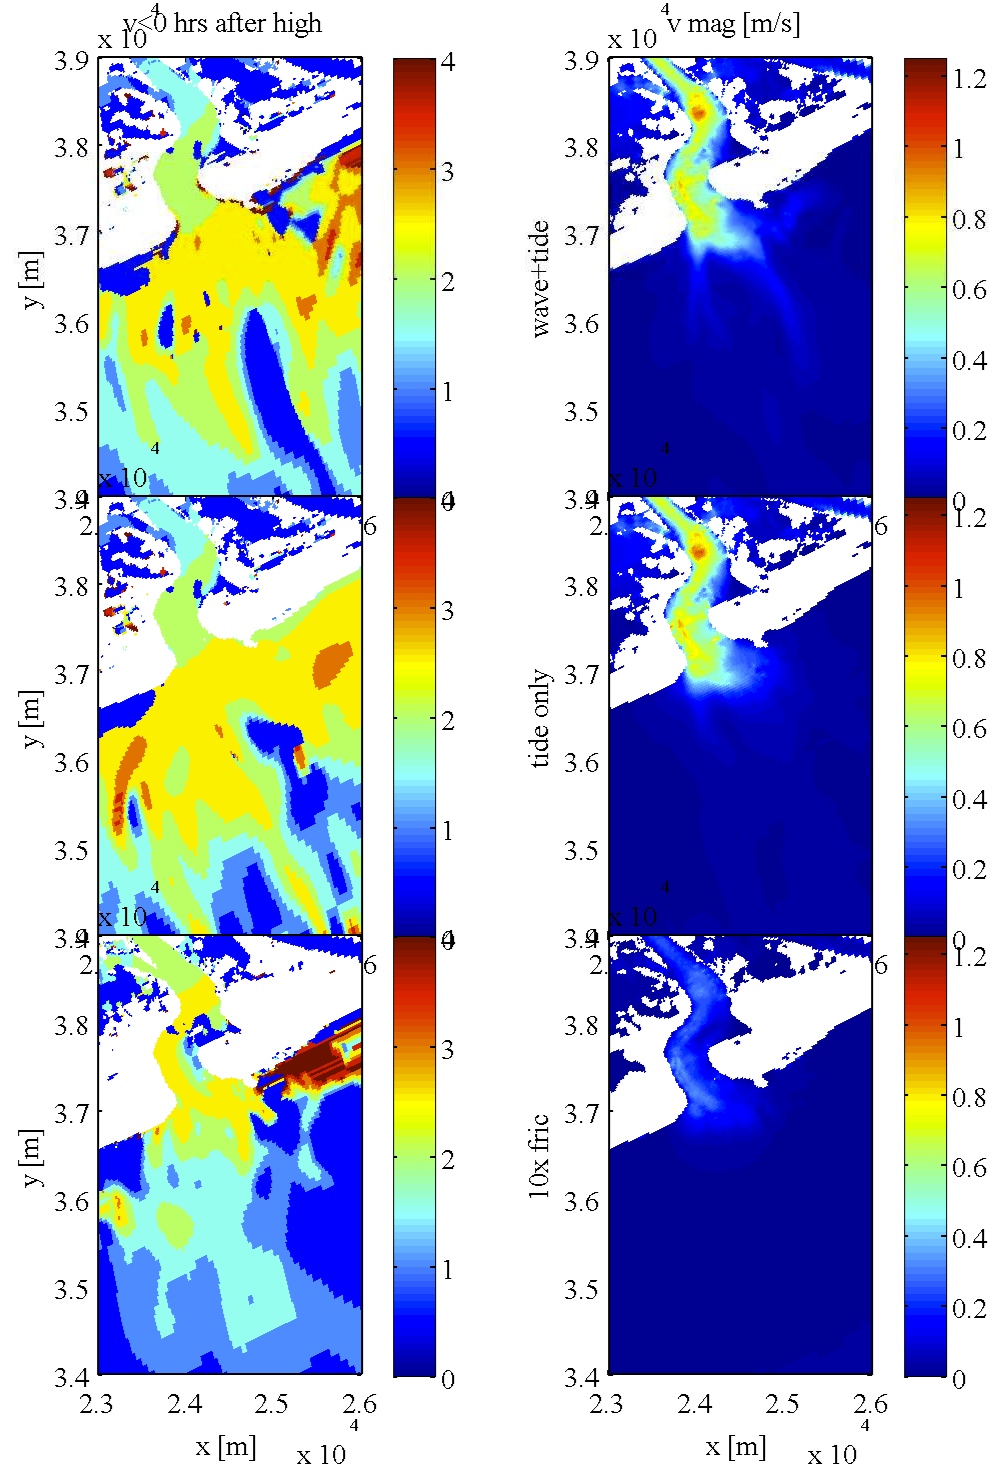
The results of the tide-only run are broadly consistent with the analysis of the Delft3D model output. Although the coordinate system that NEARCOM and Delft3D are using are different, the pattern of time-lag is similar for the tide only case. Note also that for 10X higher drag coefficient, the tidal velocities and phase radically change. Both Delft3D and NEARCOM model data are output at 1/2 hr intervals (99% sure). This limits the resolution of estimating this time lag. However, based on the various simulations, it appears that an average of 2 hr lag inside the inlet is appropriate. -Falk