After arriving on Monday, our NRL SAR crew flew on Tuesday, Wednesday, and Friday of this week. Apart from some drama before the first flight (resolved with a 300-foot daisy chain of extension cords across the airport tarmac), we’ve had no major hardware issues and have enjoyed excellent SAR collection conditions: decent surface winds to roughen the water, but smooth flying at 2900′. Smooth air is doubly appreciated, since it makes compensating for aircraft motion easier while it keeps me (Sletten) from throwing up.
Our sensor is an X-band SAR that operates in an interleaved along-track/cross-track interferometric mode (ATI/XTI). The ATI imagery provides measurements of the line-of-sight component of the surface velocity (closely related to the line-of-sight component of the surface current), while the XTI imagery is a measure of the surface elevation, i.e., the wave height.
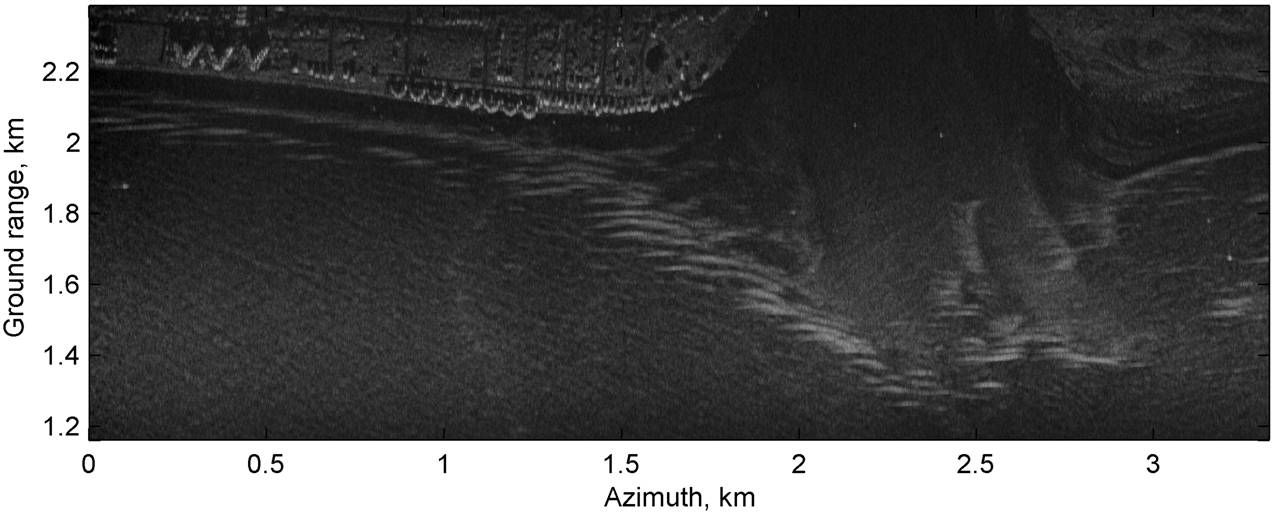
Below is a magnitude image (black and white) of the inlet along with its corresponding, quick-look ATI phase image (color). These data were collected on Wednesday morning at 11:48 AM EDT, approximately one hour after the predicted low (also max ebb) tide. The south side of the inlet can be seen clearly on the left side at the top, while the north side is visible to the right but is fainter. We were flying over the Atlantic looking towards the land during this particular run. The shoaling waves are obvious in the magnitude image, but both the breakers and the strong ebb flow are visible in the velocity (i.e. phase) image. We haven’t done any motion compensation yet, so the land is not uniformly motionless, but the phase calibration is still pretty good thanks to the smooth air. The flow through the inlet appears to be split into a north and a south channel, with a velocity close to 1.5 m/s towards the radar, which is negative using our convention. Note that this is the ATI-SAR velocity, not the current. (The pesky velocity contribution of the waves themselves has not yet been estimated and removed.) The crest velocity of the breakers is high enough to cause the phase to wrap, which is the source of the rapid color changes across these regions.
The XTI quick-look interferograms are still to come. The signal from one of our XTI antennas is a bit anemic, and we hope to track down the reason this weekend. (Well, Steve is hoping to track that down. I’m actually back home in Washington DC.)