Today I tried initial analyses on “vBar” pixel instruments to measure tidal currents in the inlet. These are based on Chris Chickadel’s work and seemed potentially applicable to this situation of co-aligned waves and currents in the inlet. Below shows the locations of estimates.
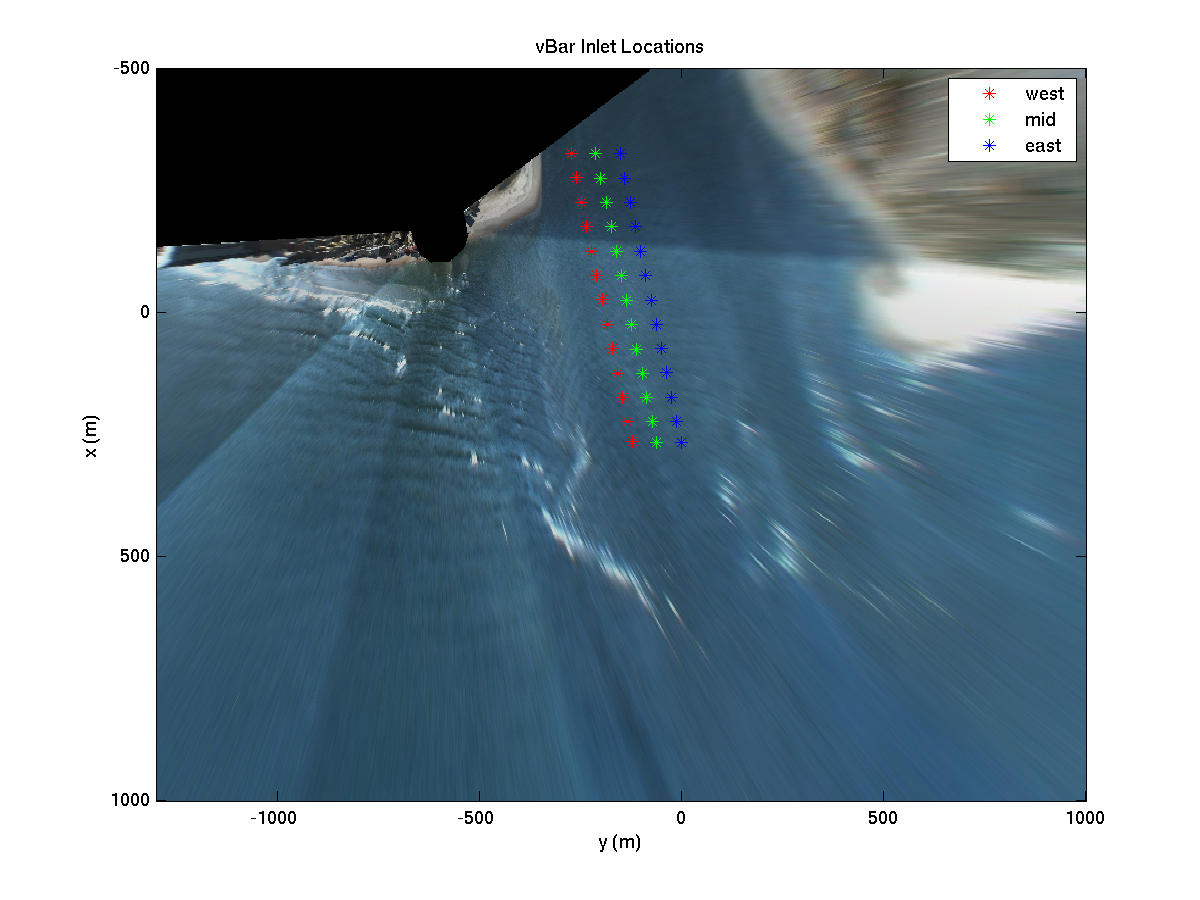
The figure below shows ebb current estimates for each of the three lines. Locations of zero current are mostly where pixel resolution has degraded. The cross-inlet structure and along-inlet gradients seem interesting. Of course, I have not compared against any ground truth (but hope to).
These are initial experimental results that we will work further on. We collected these data for one transect every half hour since 04/29 and added the two other transects on 05/10. We will begin bulk analysis soon-ish.
![]()
If you are interested, here are four plots illustrating the method. The first is just an example stack and shows the mix of waves propagating into the inlet (down left) and current streaks showing ebb flow (down right). This is a moderately easy case with strong current signatures.

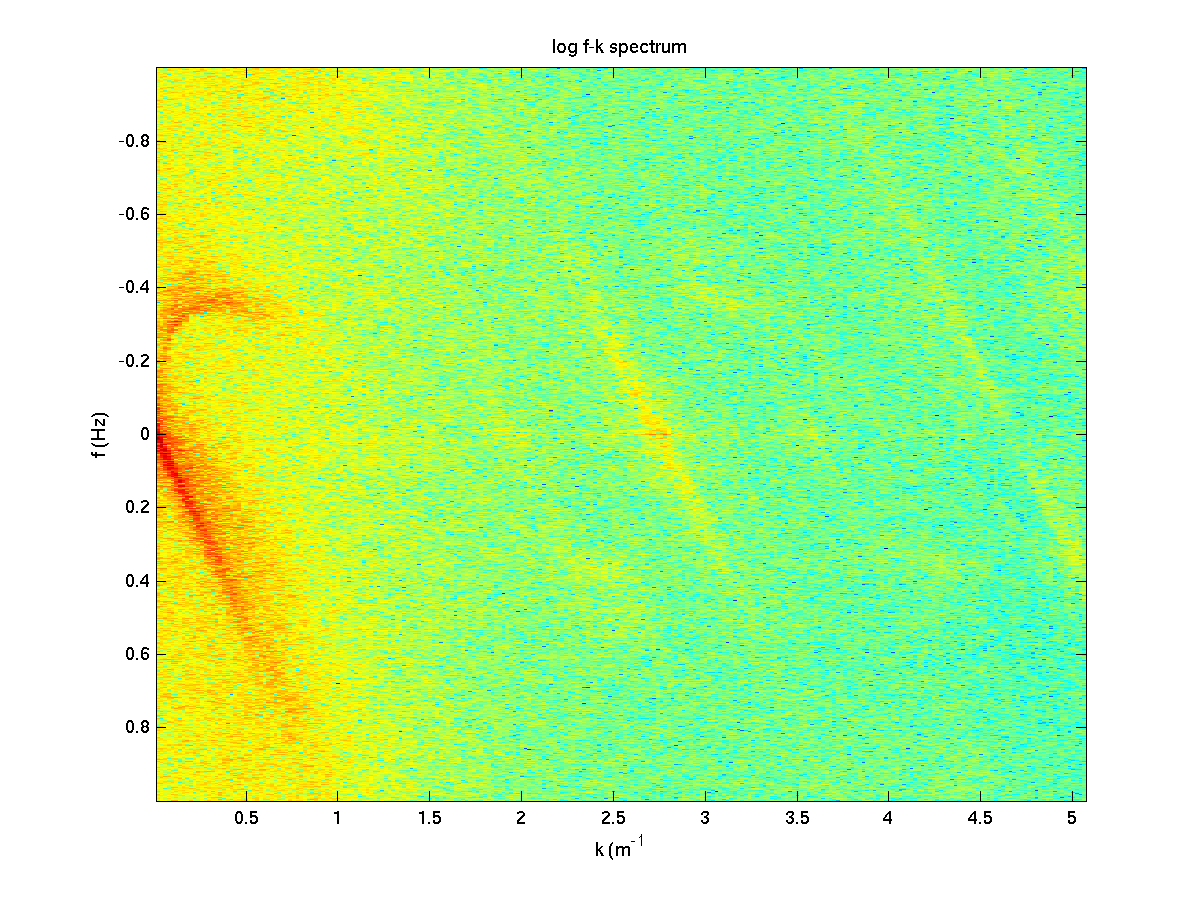
The second figure shows the corresponding f-k spectrum (using a convention of +/- frequency and positive wavenumber). The ridge of energy going down right corresponds to the current. The curved shape in the upper half corresponds to the gravity waves and would normally be roughly parabolic but the current turns the dispersion curve. The analysis exploits the current ridge but could also exploit the wave Doppler shift (later???). (This is my coolest plot). Streaks at high k are from aliasing and are not included in the analysis.
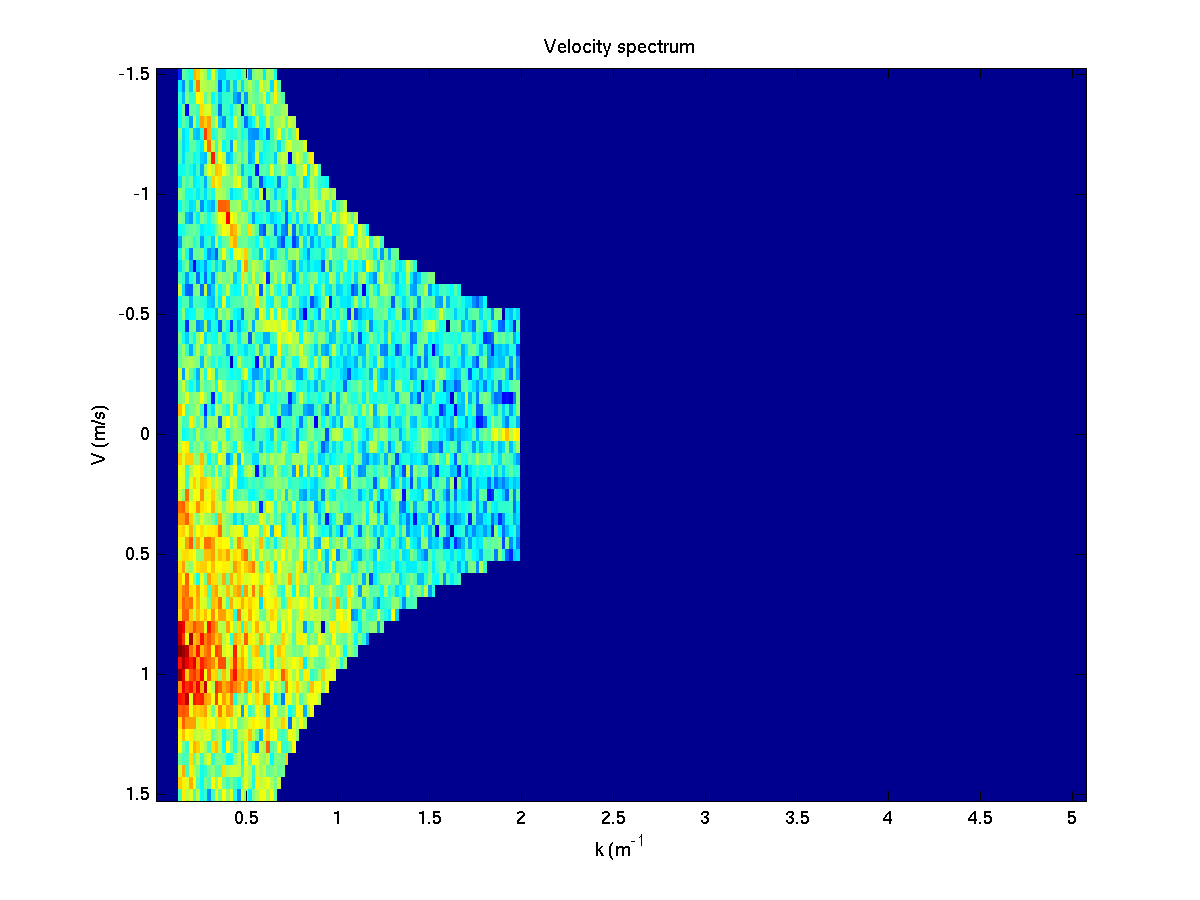
The third figure transforms the f-k spectrum to V-k space, a al Chickadel.
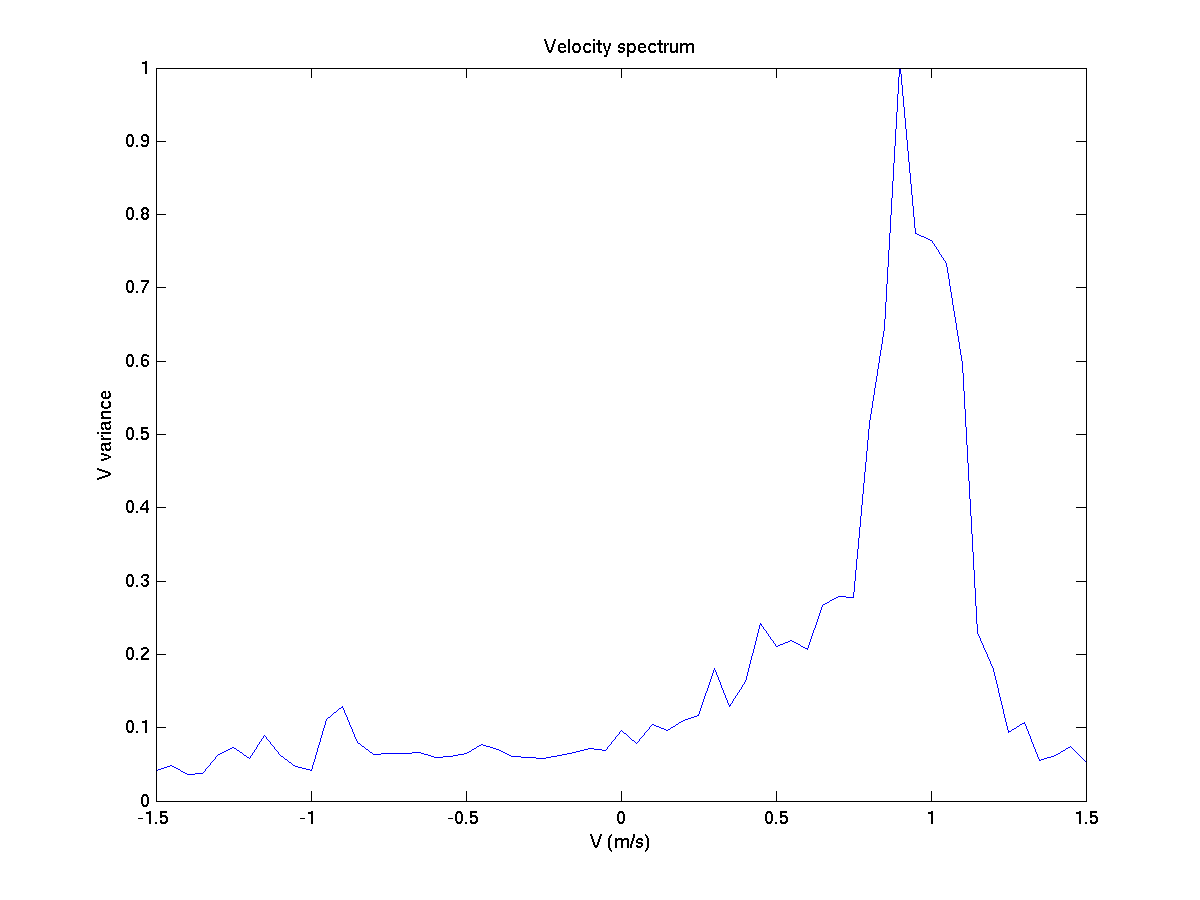
The fourth figure integrates through k to give a variance versus V curve. The peak (Gaussian fitted) is the estimated current. This case is the landward-most point in west transect, so V ~ 95 cm/s.