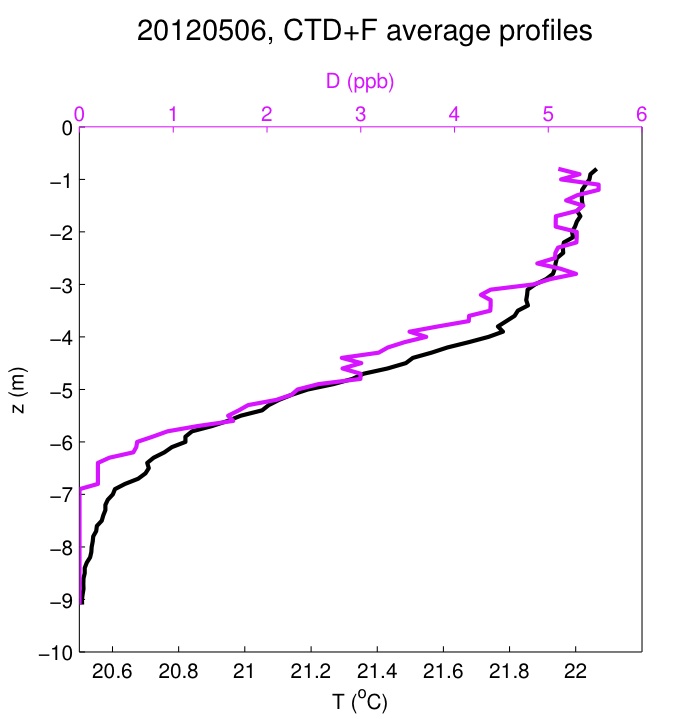
Data from CTD+F casts have now been processed. Casts were made from a small boat on dye release days. The CTD+F setup included a Seabird CTD and WET Labs single-channel fluorometer. Casts were generally made from near the surface to the bed.
Below is an example of mean dye and temperature profiles from 6 May, 2012.

Average temperature (black) and Rhodamine WT dye (pink) against depth z for all profiles on May 6 2012.
Data are now available via the ftp site in a directory called CTD. See previous posts on how to access the ftp site. Data from each day of casts are in .mat files with filenames data_nr12_CTD_mmdd.mat, where mmdd represents the two digit month and two digit day. Each data file contains the following variables:
>> load data_nr12_CTD_0512.mat
>> whos
Name Size Bytes Class Attributes
Dgrid 101×50 40400 double
Sgrid 101×50 40400 double
Tgrid 101×50 40400 double
date 1×8 16 char
tcast 50×1 400 double
xcast 50×1 400 double
ycast 50×1 400 double
zgrid 101×1 808 double
“Dgrid”, “Tgrid”, and “Sgrid” are the dye (ppb), temperature (deg C), and salinity (psu) vertical profiles for each day of casts, where each column is an individual cast. Data are interpolated onto “zgrid”, which spans the water column from the surface (z = 0 m) to the depth of the deepest cast with 0.1 m vertical resolution. Data below the deepest point of a given cast are filled with NaNs. For the example variables above, if
>> [m,n] = size(Dgrid)
then m = 101 is the number of vertical grid points (z = 0 to -10 m), and n = 50 is the number of casts.
The variables “tcast”, “xcast”, and “ycast” give the times and locations of each cast, where, e.g., tcast(k) corresponds to Dgrid(:,k). Time units for “tcast” are in seconds (EDT) of the given day (which is saved in each .mat file as the variable “date”). The variables “xcast” and “ycast” are the familiar RIVET coordinates x and y, respectively, both in meters.
